Setting up Flow in Highlight
Overview
To see traffic breakdown by application or host, Flow must first be enabled on the monitored device. A Flow Collector is also required.
Find out more about device configuration for Flow and planning for Flow collection.
Highlight configuration steps for Flow


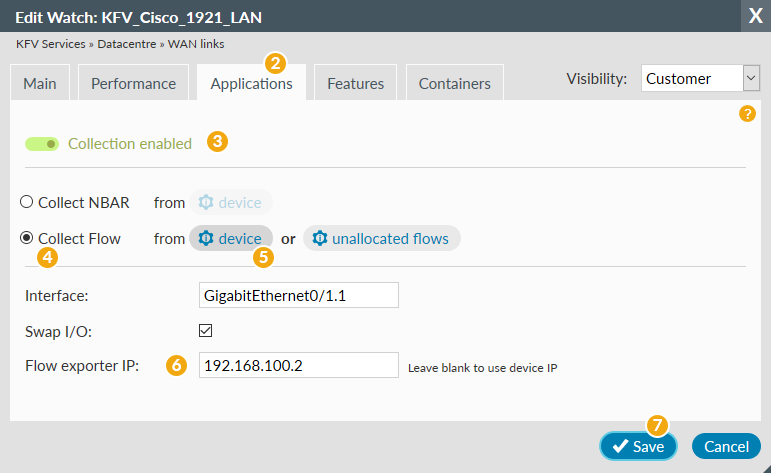
- Select the location containing the device on which to configure Flow and select Admin tab. Click the bearer watch to be edited. Note: Step 1 is not shown in the images above.
- Select the Applications tab on the Edit Watch dialog
- Ensure Collection enabled (green toggle showing)
- Ensure Collect Flow is selected
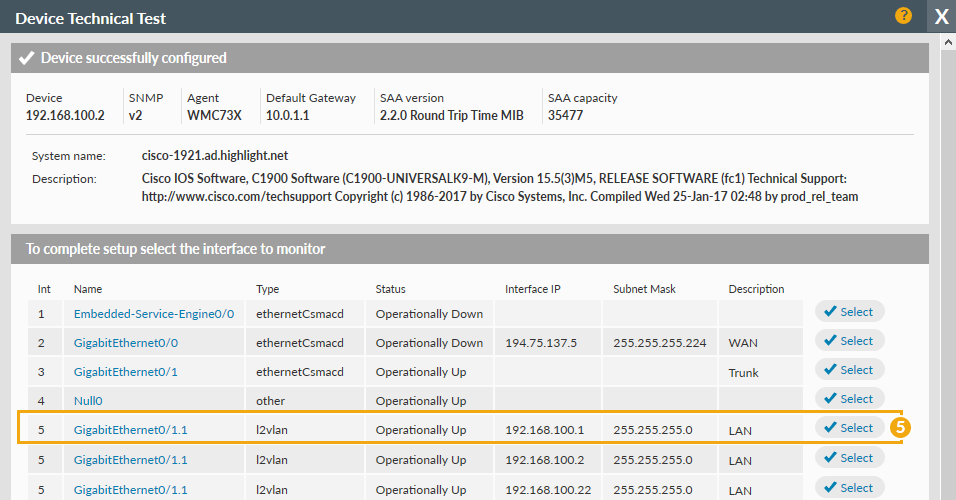
- Use to test for the interface and the appropriate one from the list in the Device Technical Test dialog (see note 1 below). can also be used to select the correct interface ID number and source IP for flow, based on flows received by the agent but currently unallocated. Find out more about unallocated flows.
- Complete the Flow exporter IP if required (see note 2 below)
Note 1: the interface selected should generally be the same as that on the Main tab used for Link Health, so a direct comparison can be drawn between Link Health volumes and Flow information.
However for operational reasons perhaps due to WAN traffic being encrypted, an alternative interface may be needed. Take care to ensure the interface which has Flow analysis applied in the router configuration corresponds with the interface selected in Highlight for Flow monitoring.
(For Cisco) Compare with the output from show ip flow interfaces command
Note 2: the "Flow exporter IP" should be the source IP of the Flow packet, usually corresponding to the (Cisco) configuration ip flow-export source or the flow exporter source commands. Compare with the output from the show ip flow export command
If Flow monitoring fails to start after 30 minutes, refer to Troubleshooting Flow or contact us
To identify Flow watches that are no longer reporting refer to the Admin Watch report. Any Flows with last good sample prior to today requires Troubleshooting.