Sensitivity
Overview
As we have seen, heat tiles are a very smart way to look at network issues, whether it’s stability, load or health. However, as Highlight is capable of live alerting via email, webhook and SNMP trap, you can modify the rate at which watches change colour and therefore, generate alerts. This page details changing the sensitivity at the folder or location level. It's also possible to set a sensitivity profile on an individual watch, see the Sensitivity profiles per watch section below.
Find out more about configuring alerts. From Status Alerting all users can access the Sensitivity panel; only users with the permission Manage Folders/Locations, can edit the sensitivity settings.
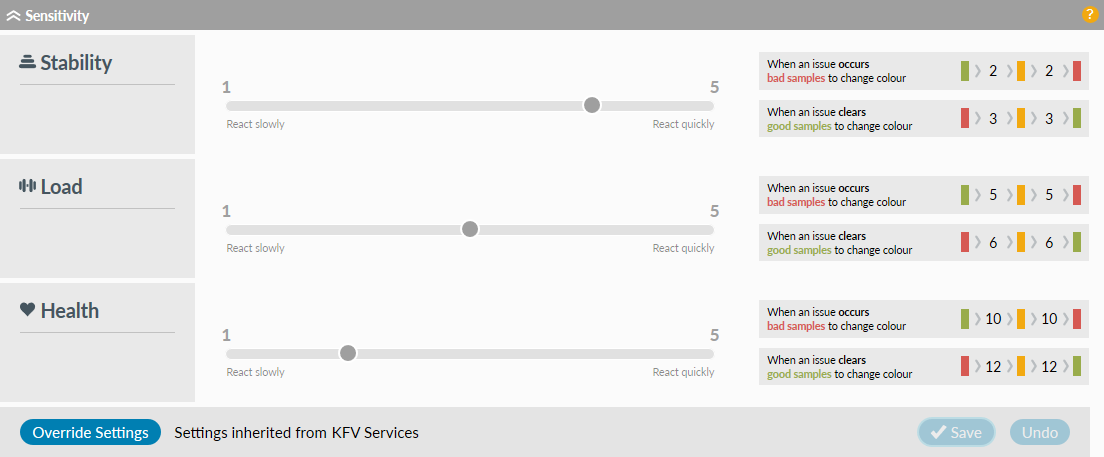
You can define how quickly watches react to issues by moving the sliders for stability, load and health. Initially everything will be greyed out. To make a change for a specific folder or location you will need to click which will then override the inherited setting and allow you to set new sensitivity levels for the folder or location you are in and all folders below it. You can always remove any local settings you have created by selecting the option and the sliders will revert to the inherited values.
Sensitivity profiles per watch
It's possible to change sensitivity at the individual connection (watch) level. This means at a location with two types of connection, a leased line can continue to react quickly if down, but a broadband line can be set to react slowly.
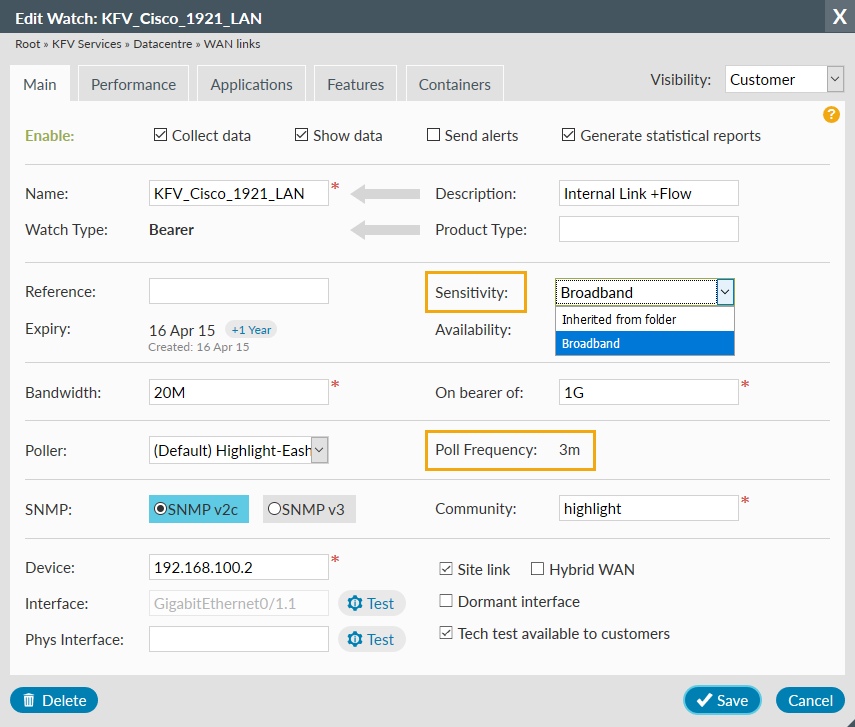
The polling frequency for each watch (which is typically 1, 3 or 5 minutes) is shown in the edit watch dialog. This is useful to determine the time from when an issue starts until alerts are sent and watches/tiles change colour.
For multiple new watches you can set the sensitivity profile using our bulkload process.
You can discover the polling frequency and sensitivity profiles for bearer watches by running the Admin watch report.
Find out more about edit watch. Contact us for more information about sensitivity profiles per watch.
Sample numbers

The numbers to the right each category tell you how many samples need to be received before Highlight reacts:
- bad samples
- the number of bad samples to go amber then red from full health
- good samples
- the number of good samples to revert to amber then green from fully unhealthy
In the example shown above a fully healthy watch will go amber after 5 bad samples, and if the issue is ongoing it will go red after a further 5 bad samples (total 10).
Assuming a 3 minute polling cycle, it would therefore take approximately 15 minutes to change a green watch to amber and another 15 minutes to turn it red.
Basic settings
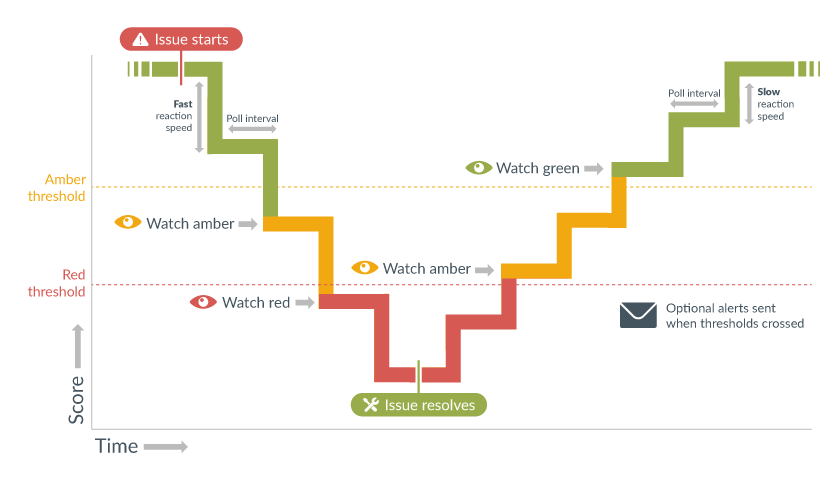
The graphic below shows how Highlight can be configured to react quickly to issues but return more gradually to a state of full health. The watch with an issue (and its associate location tile) will change from green to amber when the amber threshold in crossed and from amber to red when the red threshold is crossed. Email alerts are also sent (if configured) when the thresholds are crossed.
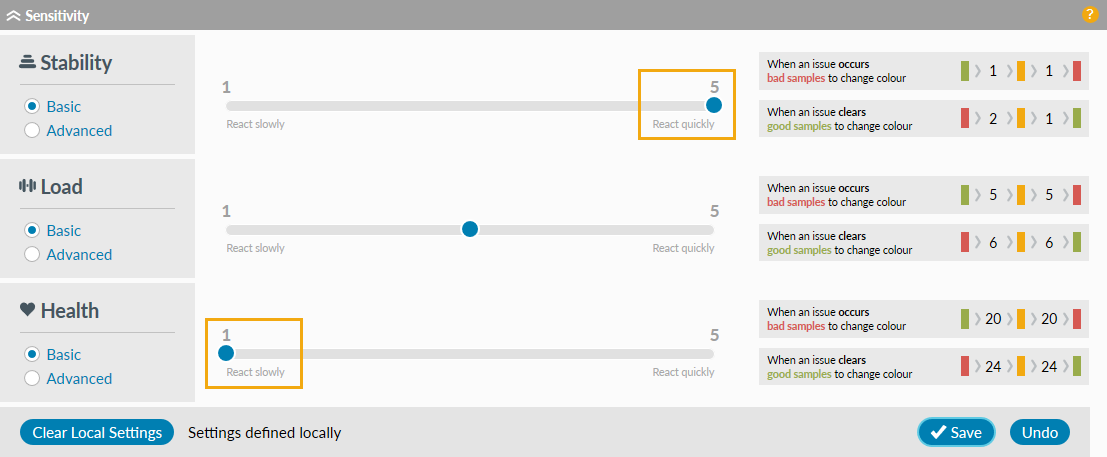
In the example here, stability is set to react quickly (slider at rightmost position 5), and health is set to react slowly (slider at leftmost position 1).
React quickly
(Stability in the above graphic)Going sick:
Because of the react quickly setting, the first bad sample will turn a green watch amber and the next bad sample will then turn the watch red.
Returning to healthy:
Once the watch is red because of stability, it will turn amber after 2 good samples and green after 1 additional sample.
React slowly
(Health in the above graphic)Going sick:
Because of the react slowly setting, it would take 20 bad samples to turn a green watch amber and an additional 20 to turn it red.
Returning to healthy:
Once the watch is red because of health, it will turn amber after 24 good samples and green after 24 additional samples.
Slider Values
| To go Sick (from full health) | To go Healthy (from fully unhealthy) | |||
|---|---|---|---|---|
| Slider Position | Amber after | Red after | Amber after | Green after |
| 5 - rightmost | 1 | 2 | 2 | 3 |
| 4 | 2 | 4 | 3 | 6 |
| 3 | 5 | 10 | 6 | 12 |
| 2 | 10 | 20 | 12 | 24 |
| 1 - leftmost | 20 | 40 | 24 | 48 |
Notes:
- 5 is the rightmost slider position, 1 the leftmost
- “To go Sick” is the number of bad samples in a sequence required to go amber or red, from full health (green)
- “To go Healthy” is the number of good samples in a sequence required to go amber or green from no health (red)
- As an example, slider position 3 will cause the watch to go amber on receipt of the 5th bad sample which, for a 3 minute polling cycle, will be 12 minutes after the first bad sample is detected
- A bad sample can be one with a) no response, b) exceeds thresholds, or c) contains test failures
- A Highlight sample comprises the processed result from an SNMP request to a monitored device, one sample for every polling cycle. Separate samples are collected for line health, switches and performance tests, plus autodiscovered elements - classes, VLANs, multilinks, and tunnels.
Advanced settings
If you want more granular control over reaction speed, select Advanced and you can set individual thresholds, increments and decrements. We recommend only doing this if you understand these settings or contact us for additional explanation. Selecting Advanced will display the watch colour thresholds, and changes associated with bad or good samples, based on a score of 1000 being full health. To adjust the amber/red thresholds either use the slider or type in a new value.
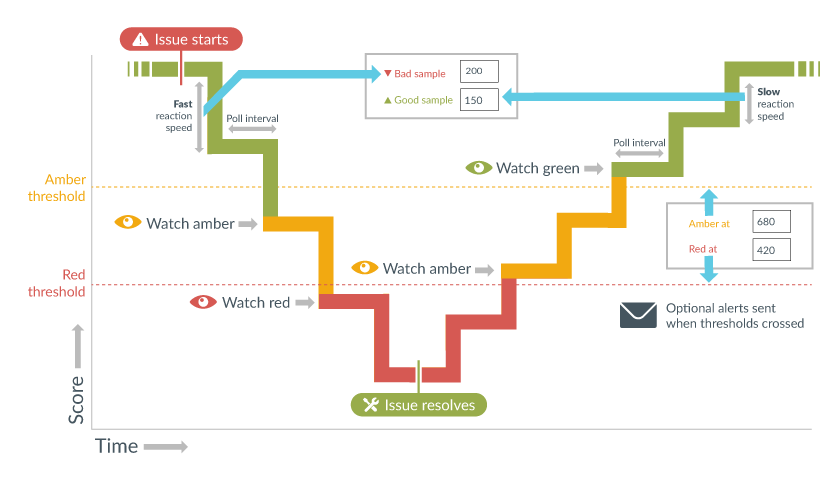
The graphic above shows how Highlight can be configured with precise amounts ( Bad sample is
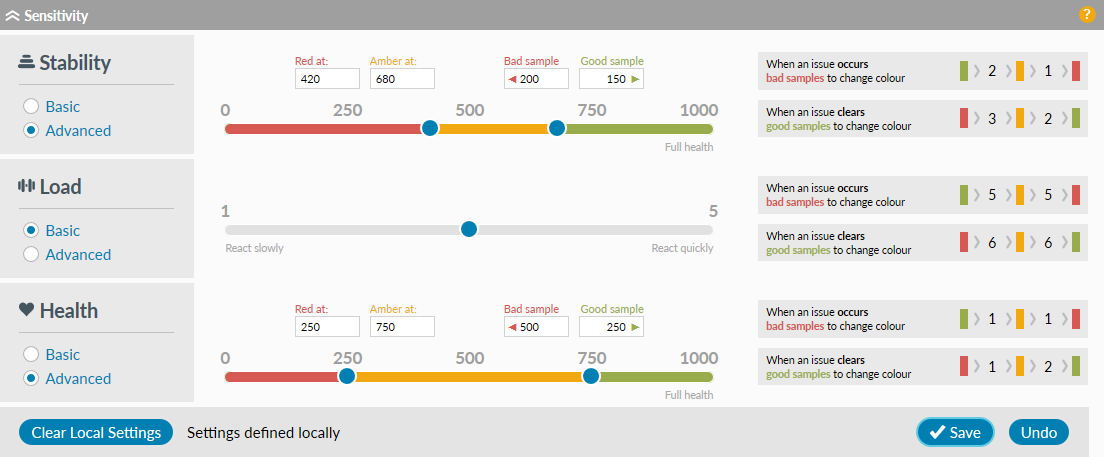
To adjust the amber/red thresholds either use the slider or type in a new value. The number of samples required to change the colour will automatically adjust to reflect the new settings. Similarly type in new decrement (Bad sample) and increment (Good sample) settings as required, and once completed click
will revert settings to the last save. Basic will revert an individual slider to position 3 irrespective of its previous position.
Advanced example:
(Stability in the above graphic)| Sample sequence | Sample type | +Increment/-Decrement | Watch score | Tile colour |
|---|---|---|---|---|
| Fully green | Good | +150 | 1000 | Green |
| +1 | Bad | -200 | 800 | Green |
| +2 | Bad | -200 | 600 | Amber |
| +3 | Bad | -200 | 400 | Red |
| +4 | Bad | -200 | 200 | Red |
| Fully red | Bad | -200 | 0 | Red |
| (From fully red) +1 | Good | +150 | 150 | Red |
| +2 | Good | +150 | 300 | Red |
| +3 | Good | +150 | 450 | Amber |
| +4 | Good | +150 | 600 | Amber |
| +5 | Good | +150 | 750 | Green |
| +6 | Good | +150 | 900 | Green |
| Full health | Good | +150 | 1000 | Green |
Becoming unhealthy:
Because Bad sample is set to 200 it will only take 2 bad samples to pass the amber threshold of 680 from full health, and turn the watch from green to amber, and an additional bad sample to pass the red threshold at 420 and turn the watch from amber to red.Returning to healthy:
The Good sample setting is 150 so, if starting from a score of 0 (fully unhealthy), it will take 3 good samples to pass the red threshold of 420 and turn the watch from red to amber, and an additional 2 good samples to reach the amber threshold at 680 and turn the watch from amber to green.Returning to healthy if not fully unhealthy:
For this example if only 4 bad samples in a sequence had been received, our starting score would be 200 and it will only take 2 good samples to pass the red threshold of 420 and turn the watch from red to amber (score now = 500), and an additional 2 good samples to reach the amber threshold at 680 and turn the watch from amber to green.
Advanced further example:
(Health in the above graphic)Becoming unhealthy:
Because Bad sample is set at 500 it will only take 1 bad sample to pass the amber threshold of 750 from full health (and turn the watch from green to amber) and an additional bad sample to pass the red threshold at 250 (and turn the watch from amber to red).Returning to healthy:
Because Good sample is set to 250 it will only take 1 good sample to reach the red threshold of 250 (and turn the watch from red to amber) and an additional 2 good samples to reach the amber threshold at 750 (and turn the watch from amber to red).
Note: Watches normally turn amber/red more quickly than when they are returning to healthy. This is to allow for repeatedly receiving a bad sample followed by a good sample ("flapping"). After a period of time, the watch would still turn amber and eventually red to show there's an issue.