WiFi Controller Details
Overview
This page describes the data and graphics available for a WiFi controller on the Details page.
For an introduction to WiFi monitoring in Highlight refer to the Status WiFi Monitoring page.
Controller View: Access point usage
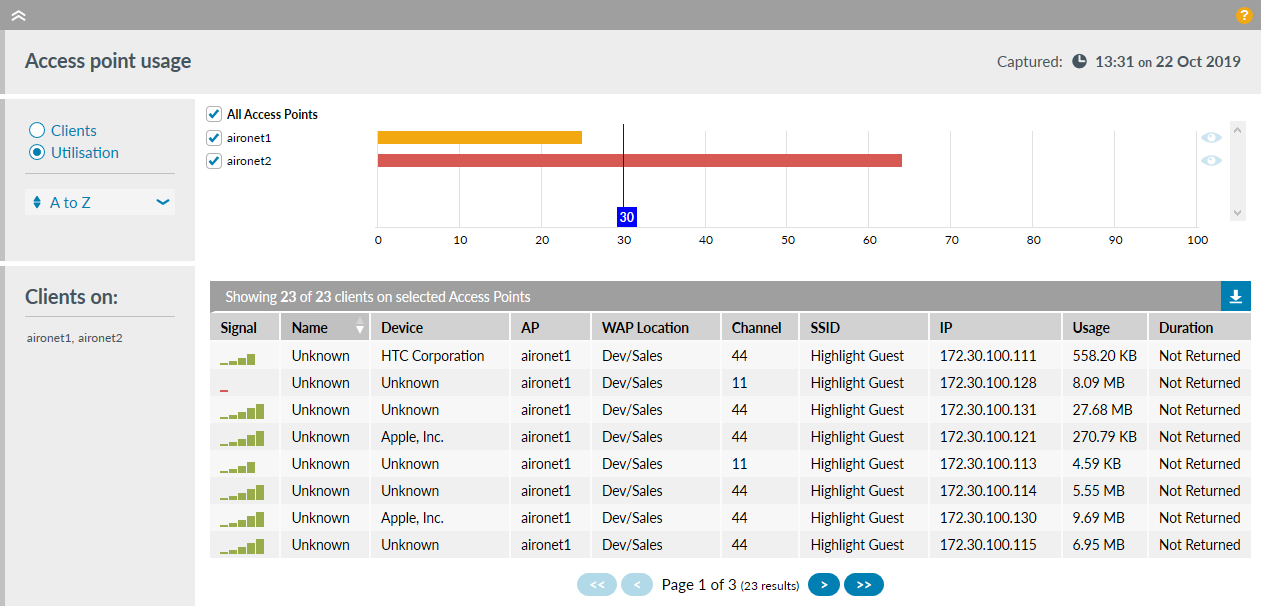
This panel gives a near real-time view of the selected Wireless Controller, valuable for fault-finding or for providing a detailed understanding of how an AP is being used. You can see utilisation rates and the number of clients in total and on each access point. Utilisation, if available for your device, shows the higher percentage utilisation of the two radio channels, 2.4GHz or 5GHz, on each AP and uses the alerting threshold of Wireless Utilisation to colour each bar green, amber or red.
Captured:

Alerting thresholds: WiFi - Client Count and Wireless Utilisation are shown as vertical blue lines on the chart and used to colour the bar for each AP
- Clients
- Shows the total client devices on each access point (AP) as a coloured bar. Hover over the bar to see the actual value.
- Utilisation
- At the moment of capture, shows for every AP the higher percentage utilisation of the two radio frequencies, 2.4GHz and 5GHz. Hover over the bar to see the actual percentage plus the current channels used on the 2.4GHz, 5GHz frequencies. For example 43% | ch: 1, 36 means one of the two frequencies currently has utilisation of 43%, plus 2.4GHz is using channel 1 and 5GHz is using channel 36.
The setting of Clients or Utilisation and selected sort order will be remembered when you next log in.
- A to Z or Z to A
- High to low or Low to high
- Green the value is less than 50% of the threshold
- Amber the value is greater than or equal to 50% of the threshold
- Red the value is greater than or equal to the threshold
Clients Detail Table
There is a row for each client device. Sort the table by clicking on a column header which will then turn grey with a white triangle to indicate ascending (▲) or descending (▼) sort order.
Table columns
| Bars | Signal | Signal to Noise Ratio (SNR, in decibels) |
|---|---|---|
| Strong | Strong | SNR ≥ 40 |
| Good | ≥25 and <40 | |
| Medium | ≥20 and <25 | |
| Weak | ≥10 and <20 | |
| Minimal | SNR <10 |
- Signal
- the numerical equivalent of the bars is explained in the table above
- Name
- the client username which will be Unknown if not available
- Device
- the client device (for example Apple or HTC) which will be Unknown if not available; hover over this text to view the MAC address for the device
- AP
- the name configured on the Access Point
- WAP Location
- the location configured on the Access Point
- Channel
- the channel in use at the moment of capture
- SSID
- Service Set Identifier, the name given to a wireless network
- IP
- the IP address allocated to the device
- Usage
- the total number of bytes received by a client during this session
- Duration
- the time since a client first connected in minutes or hours with a minimum of <1m

The functionality for Access Point Usage and the Client Detail Table with Aruba AirWave APs is not available