Riverbed Steelhead Monitoring
Overview
Highlight can be used to monitor traffic optimization and application breakdown across Riverbed Steelhead appliances.
Features
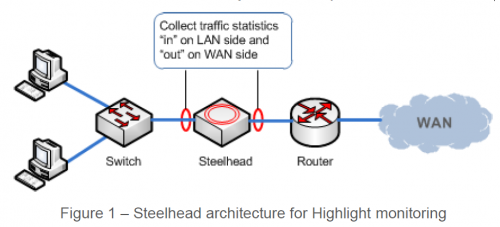
To see the optimization performed by the Riverbed Steelhead, a comparison of the LAN and WAN interface statistics will display differences in traffic volumes inbound and outbound. These can be viewed monthly, weekly or daily, including real-time updates within the Highlight Portal.
In the example below the traffic volumes entering the Steelhead on the LAN side is 826GB whereas the traffic leaving the device on the WAN side is 406GB. Therefore there has been about 51% compression in transmitted data from this site.


Application Visibility
Highlight Flow provides visibility of top 20 Applications running on the network, and top 20 Sources and Destinations of traffic. Users can pick any of these top applications or hosts, and expand it with a click to see the top 10 conversations making up that traffic flow. Drill‐downs allow users to understand traffic patterns and spot and report on trends and anomalies. Depending on the Operating system release, Steelhead appliances support NetFlow versions 5 or 9. The Highlight supported set-up to measure data from client to server is to monitor the LAN interface on the client-side Steelhead appliance; this will export the raw, pre-optimized traffic.
Image shows Highlight Flow Top 20 Application breakdown graphical and text view, and 10 conversations view.
