Release notes - January 2022
Summary
22.1 launches our new updated Traffic Load chart and SD-WAN performance tests for Meraki.
Traffic Load chart updated - BETA
We've listened to your feedback on how we visualise data. Throughout 2022, look out for updated charts on Highlight's details page which are an evolution on existing charts. Our new charts are even more intuitive, responsive and interactive. The first of these to be updated is the Traffic Load chart.
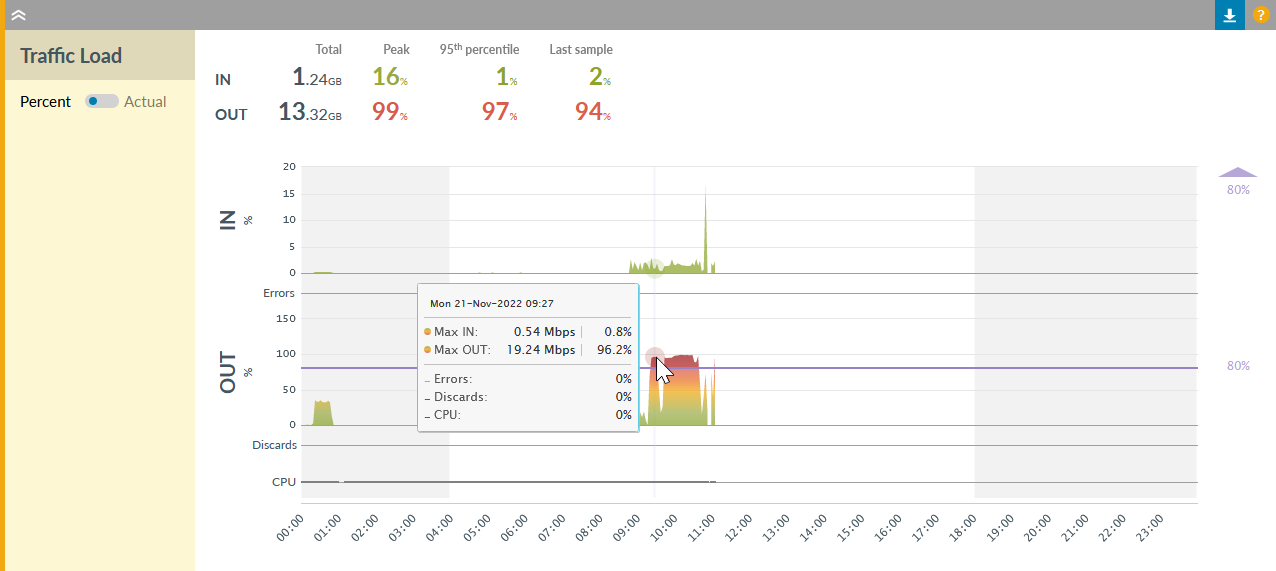
Our updated charts have the following enhancements:
- Hover on a data point to see timestamp and precise values
- Focus on data of interest by toggling some elements off
- Click to jump to a specific date from a week or month view
- Drag across a chart to zoom in to a particular time period
- See other charts aligned to the same timescale so you can quickly recognise the impact of an event
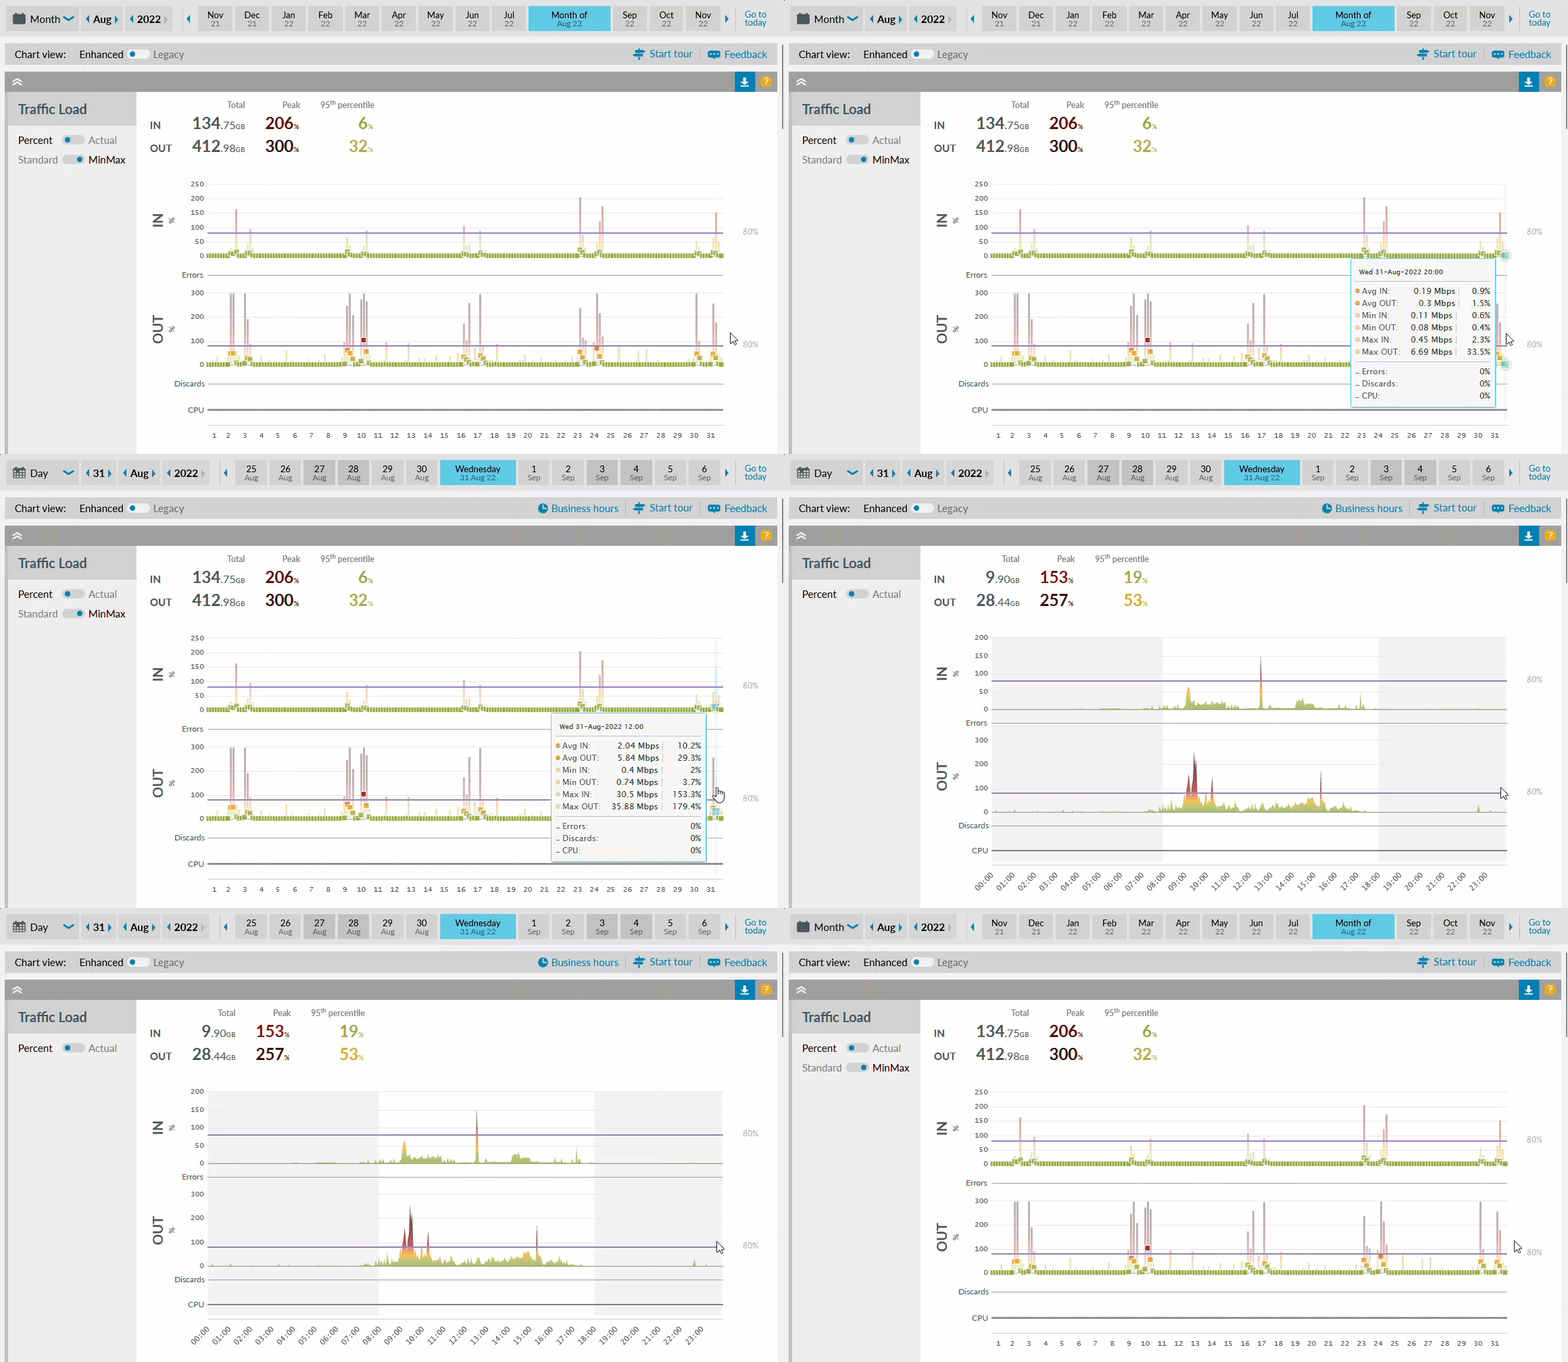
Legacy charts are still available with the new charts in Beta for now. To see the new charts, switch the toggle to BETA.
We are keen to hear your feedback on our new charts. Find out more about the new traffic load chart.
SD-WAN Overlay - Performance tests on Meraki VPN peer tunnels - BETA
In 22.1 it's now possible to discover performance tests on Meraki VPN peer tunnels. Having both tunnels and tests in Highlight enables a service provider to offer a more comprehensive managed service, alerting when thresholds are breached and providing historic reports on service performance to customers. SD-WAN performance tests are displayed as MOS/Voice tests and available throughout Highlight in:
- The performance tab on the SD-WAN edit tunnel panel
- Strip charts and on their parent tunnel details page
- Alerting
- Reporting
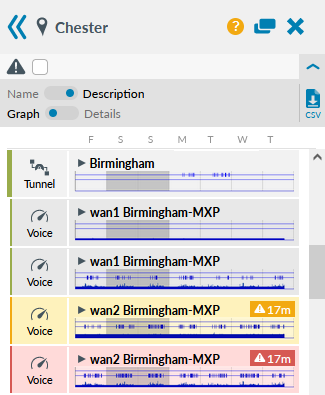
The strip charts for SD-WAN performance tests change amber then red if thresholds set on the test are breached. The sidebar on the performance chart (seen on the details page for the parent tunnel) also changes amber or red if issues occur.
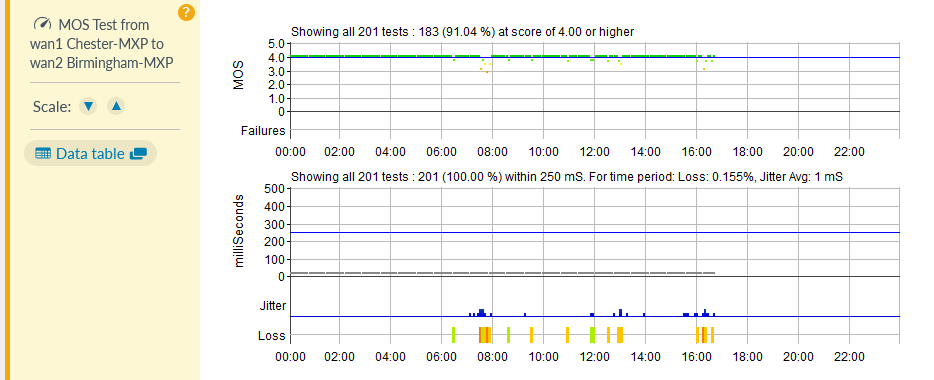
It's possible to create alerts on SD-WAN performance tests and run reports specifically for these tests which can include the parent tunnel. Highlight reporting on SD-WAN performance tests can identify trends with problem tunnels.
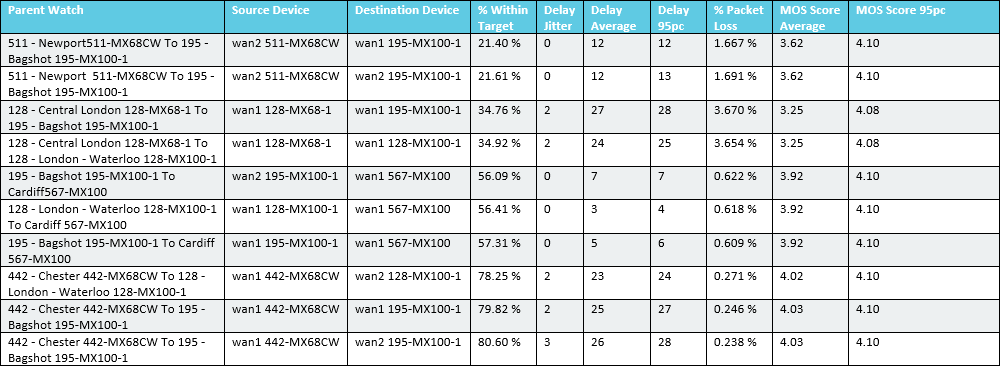
Find out more about:
- autodiscovering tunnels with performance tests
- adjusting thresholds on SD-WAN performance tests
- MOS performance charts
Walk-through tour on the Grid

In this release, we have our first walk-through tour which introduces the location options panel in 5 short steps. Learn about the any/all toggle and the grid view.
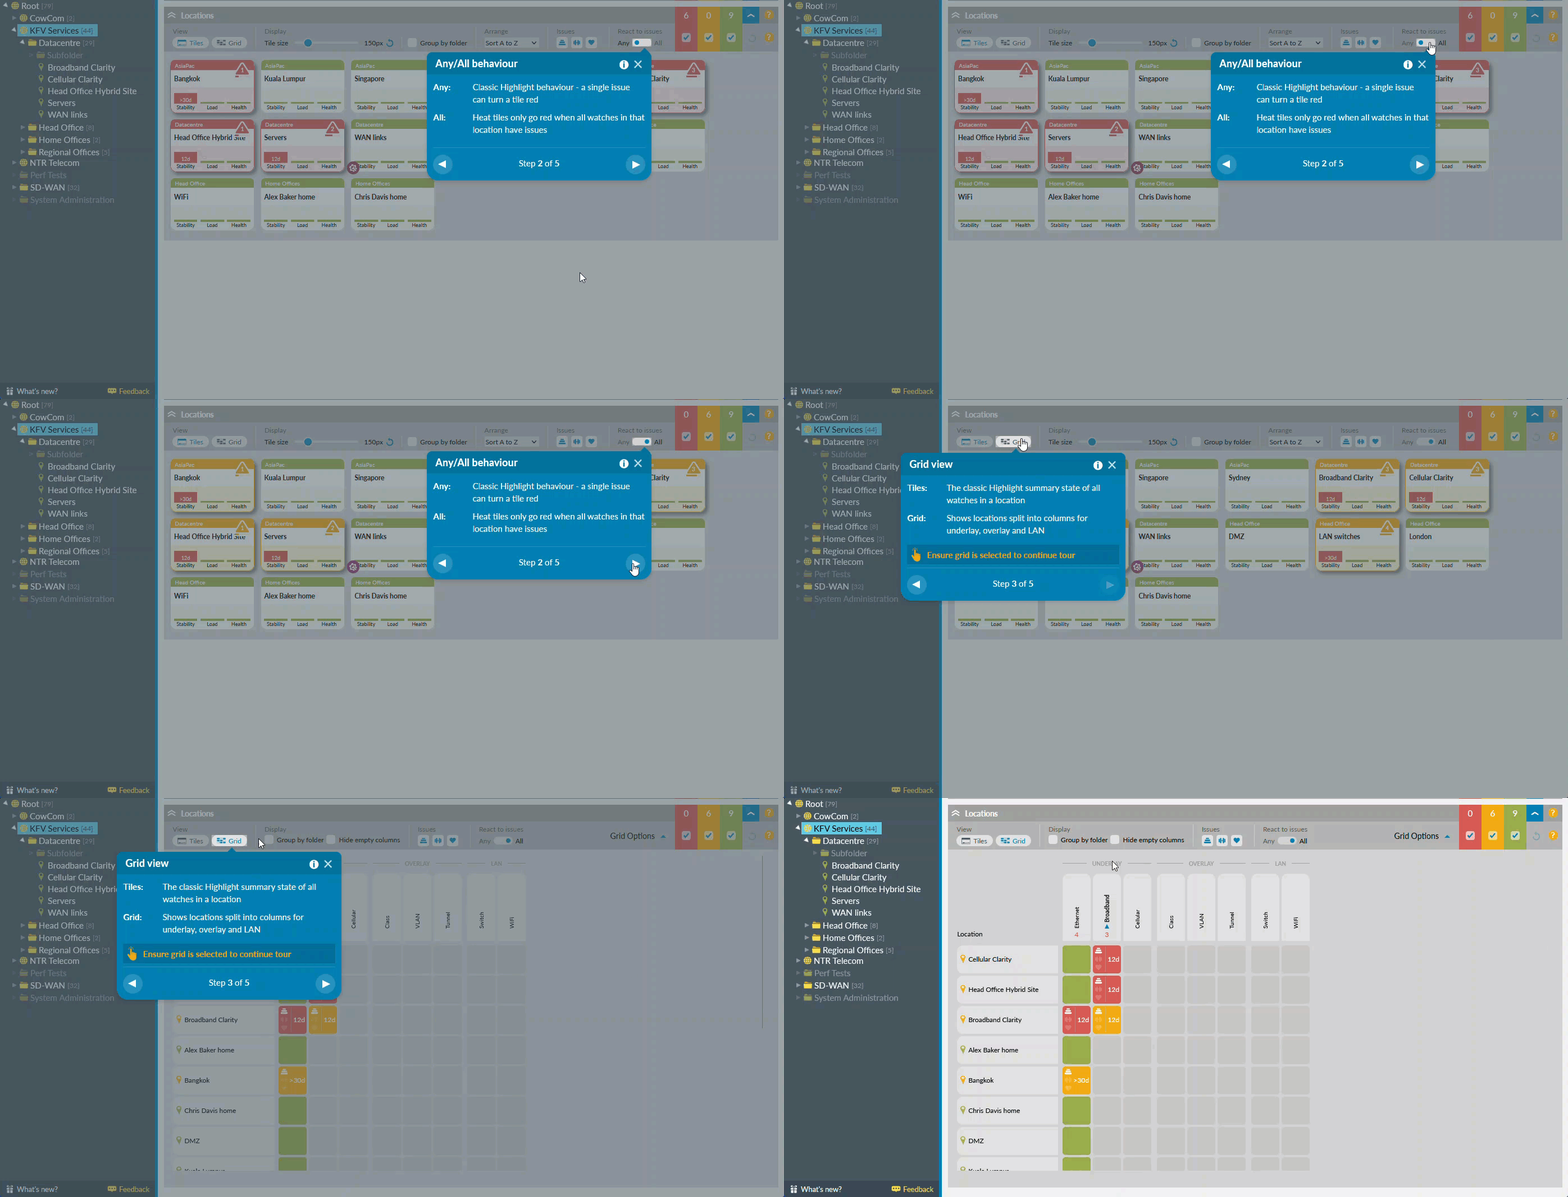
The tour starts automatically on the Status Heat Tiles page following your first login after the upgrade. The tour is also available any time from the footer of the
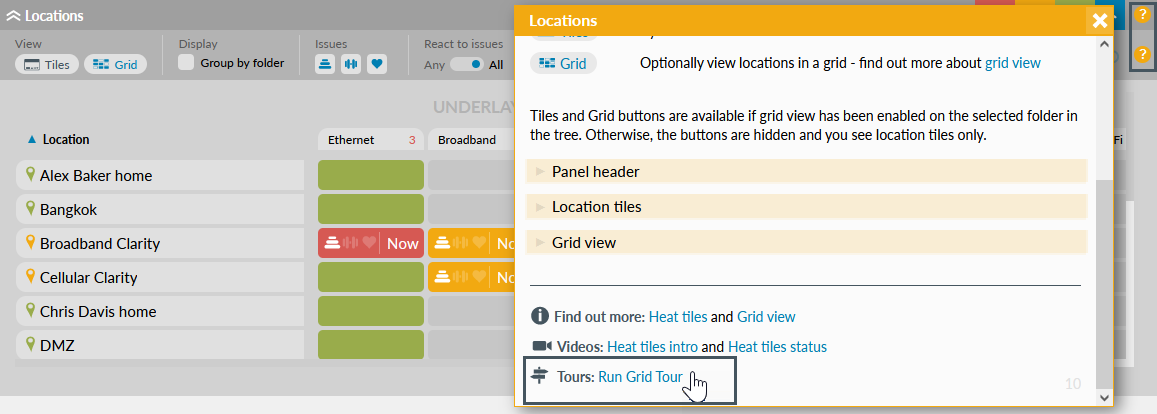
We hope to have tours on other new or updated features in the future. Find out more about tours.
Other changes
Updated calendar control

We've updated the calendar control to make navigation faster and easier, particularly when interested in a specific date in the past.

SD-WAN Overlay - Traffic Load chart for Meraki tunnels
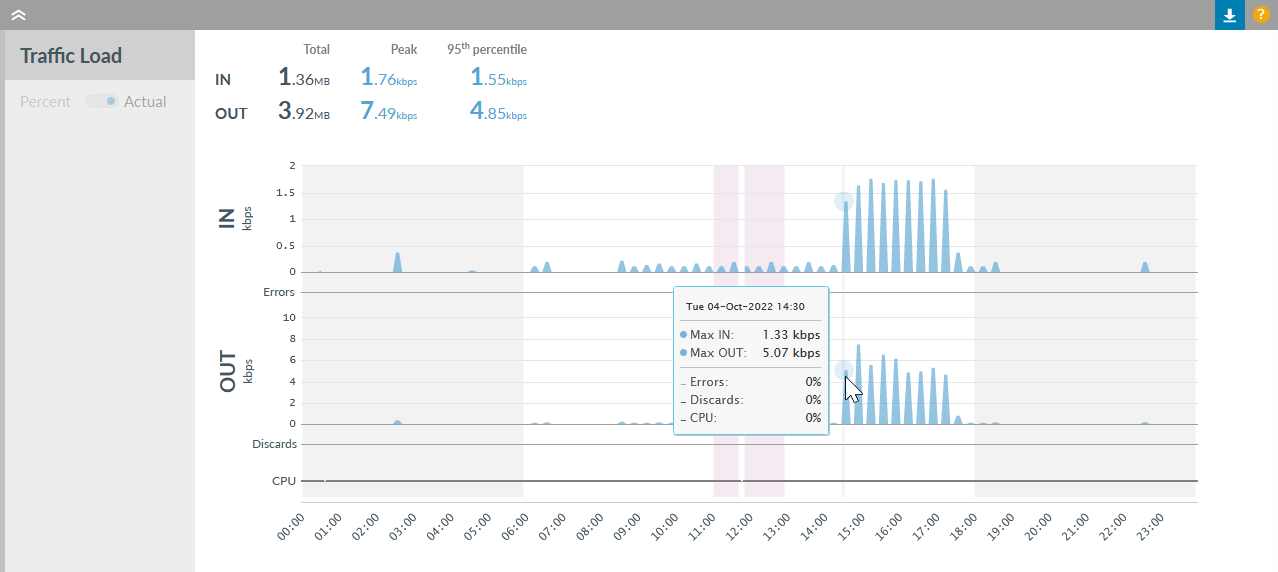
In 22.1, Meraki VPN peer tunnels now display their usage data in a Traffic Load chart. Hover to see the timestamp and precise values.
Find out more about the Traffic Load chart for tunnels.
Bug fixes
- SD-WAN: Meraki SD-WAN devices without any watches, e.g. secondary devices, are now included in the Reporting Inventory
Browser compatibility
Highlight 22.1 has been tested on the following browsers:

Firefox
Version 95.0.2 & ESR (91.4.1)

Chrome
Version 96.0.4664.110

Edge
Version 96.0.1054.62
Find out more about Highlight supported browsers.
Get in touch
More details on all of Highlight’s features are available on the Help & Support Centre or contact us for assistance.