Release notes - August 2022
Summary
22.8 includes an additional SD-WAN vendor, Fortinet, the launch of the Reporting API and performance chart updates.
SD-WAN Overlay - Fortinet supported BETA

Highlight are excited to announce support for Fortinet SD-WAN integration. Fortinet are a leading supplier of networking and security solutions, including its FortiGate™ and FortiManager™ based SD-WAN technologies.
Highlight seamlessly integrates with FortiManager using its API to collect stability, load and health data on the SD-WAN environment, presenting this data alongside the networks underlay connectivity and LAN components to provide an easy to use single-pane-of-glass.
Adding Highlight to Fortinet SD-WAN improves the alerting, reporting and transparency of the SD-WAN overlay. It also enables service providers who manage multiple Fortinet SD-WAN solutions to use a multi-tenanted FortiManager instance, reducing operational costs and complexity. Additionally, if the service provider or enterprise are managing multiple SD-WAN vendors, Highlight can provide the same easy to use single-pane-of-glass over multiple vendors, further simplifying the technology.
In 22.8, it's possible to discover Fortinet bearers, VPN peers/tunnels and performance tests. These are available throughout Highlight in:
- SD-WAN admin and edit
- Strip charts and dedicated Details pages
- Alerting
- Reporting
Having both tunnels and tests in Highlight enables a service provider to offer a more comprehensive managed service, alerting when thresholds are breached and providing historic reports on service performance to customers.

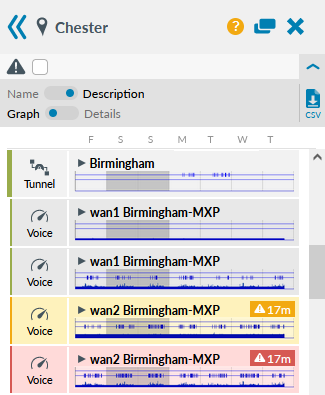
The strip charts for SD-WAN performance tests change amber then red if thresholds set on the test are breached. The sidebar on the performance chart (seen on the details page for the parent tunnel) also changes amber or red if issues occur.
Blips indicate API call failures (ongoing and recovered) or tunnel down.

It's possible to create "Tunnel-Availability" alerts and run reports specifically for tunnels which can include the parent device. It's also possible to create alerts on SD-WAN performance tests and run reports specifically for these tests which can include the parent tunnel. Highlight reporting on SD-WAN performance tests can identify trends with problem tunnels.
Find out more about:
- Autodiscovering tunnels with performance tests
- Adjusting thresholds on SD-WAN performance tests
- The tunnel Details page
- MOS performance charts
Reporting API BETA
Highlight’s Service Assurance Platform is a trusted source of real-time and historical data on the network of thousands of companies. These organisations depend on their service provider to manage their network in a transparent way, and a critical element of full transparency includes the creation of historical reports to assess and critique past performance and agree action plans. These service management reports can take a long time to compile as the statistics need to be exported from Highlight and other systems and imported into a document or analytics system for presentation. Highlight has created a Reporting API feature to dramatically shorten the time needed to generate reports, giving the service manager or IT manager time to action the findings of the report, rather than the compilation.
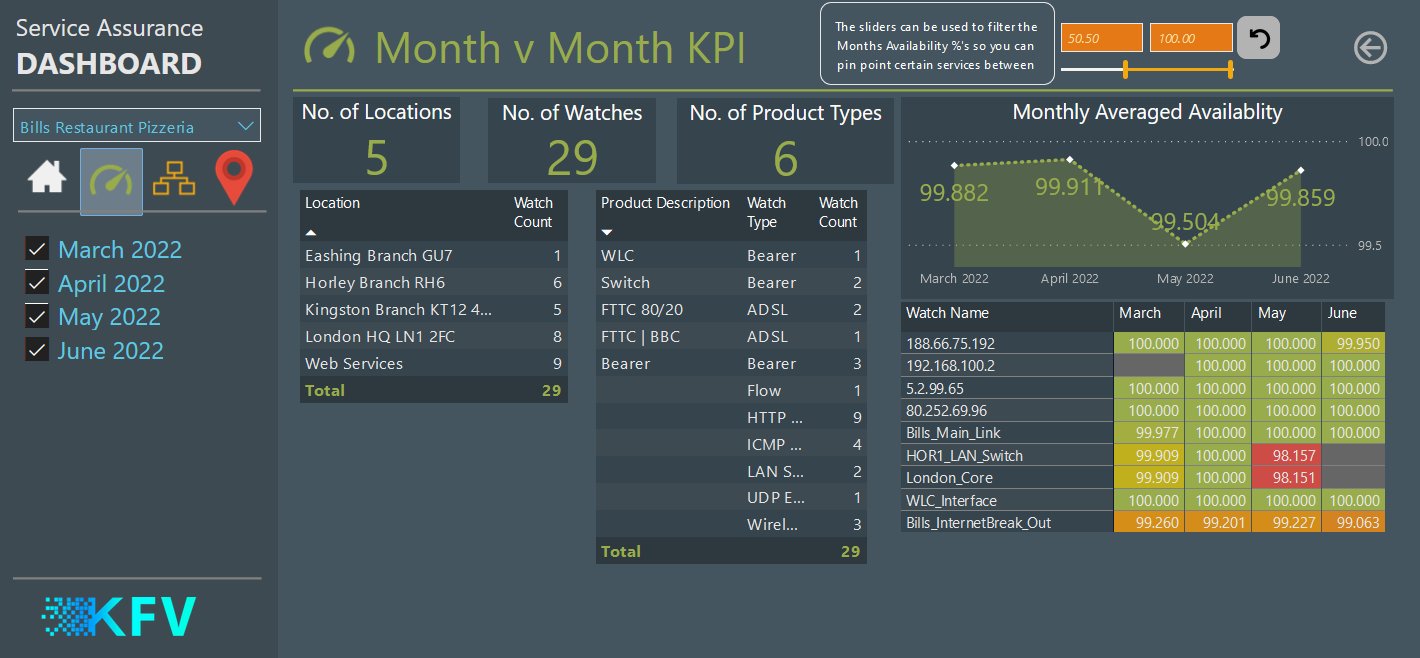
The Reporting API makes it possible to view Highlight’s historic, summarised data outside the Highlight Service Assurance Platform. After the initial set-up which creates an API key on a specific folder, you can download monthly or daily data for all connectivity services including Broadband and Cellular. This will show, for example, the total availability of a line for a given period. The data can be displayed in Excel, Power BI or another analytics tool. If needed, Highlight data can be combined with data from other sources like an IT service management system.

Highlight can provide templates for interactive reports in Excel and Power BI. We also offer professional services to assist in using the Reporting API initially. Contact us for details about using the Highlight Reporting API.
Read the Reporting API documentation and contact us for assistance in setting up and interpreting the API data or for a copy of our ready-to-use templates.
Performance charts updated

Performance charts have been updated. Data points are green when below threshold and red when above. Our updated charts have the following enhancements:
- Hover on a data point to see timestamp and precise values
- View the threshold as a purple line and percentage of tests within threshold in the right margin
- Click to jump to a specific date from a week or month view
- Drag across a chart to zoom in to a particular time period
- See other charts aligned to the same timescale so you can quickly correlate the data
Legacy charts are still available with the new charts in Beta. To see the new charts, switch the toggle to BETA.
We are keen to hear your feedback on our new charts. Find out more about the new performance charts or select the right performance test for your services.


Bug fixes
- Alerting - SD-WAN tunnels: Updated the email alert template to include the correct SD-WAN tunnel name or description in the the "Report" field.
- Broadband Clarity: Fixed an issue where a Broadband Clarity watch with auto-learned thresholds may continue to show an issue even when the threshold has been re-learned and the current value is above the new threshold.
- Cellular Clarity: The cellular clarity reports incorrectly included partial quality samples (-120dBm) in some calculations. This could lead to inconsistency between the minimum signal strength shown on the graph and the value in the report.
- Cellular Clarity: Extended the list of known radio types reported by Cradlepoint Cellular Clarity watches.
- Flexible switch ports: Fixed an issue which prevented new flexible switches from being created.
- Line Availability Event List: Fixed an issue with the Beta Line Availability Event List did not apply the correct time zone settings for the events displayed.
- Poller: Fixed an issue where the Poller may crash when polling Telindus/One Access devices.
- SD-WAN - Meraki: Fixed an issue where Meraki SD-WAN Admin and Details page for Uplink watches didn't show that the parent device could no longer be found. A banner is now clearly shown on both pages.
- Traffic Load: CPU utilisation on the Beta traffic load graph now correctly shows as a grey line if the data is not able to be collected. Previously this incorrectly showed as a green line.
- Traffic Load Tour: Added steps to prevent the tour for the new Beta Traffic Load graph from being run if the section is collapsed or unavailable.
- Watch revalidation: Fixed an issue which prevented some users from requesting a device revalidation.
Service description
The Highlight Service Description document concisely describes how Highlight works and its key features. It's updated as required and available on the Help & Support Centre.
Browser compatibility
Highlight 22.8 has been tested on the current version of the following browsers:

Firefox

Chrome

Edge
Find out more about Highlight supported browsers.
Get in touch
More details on all of Highlight’s features are available on the Help & Support Centre or contact us for assistance.