Release notes - October 2023
Summary
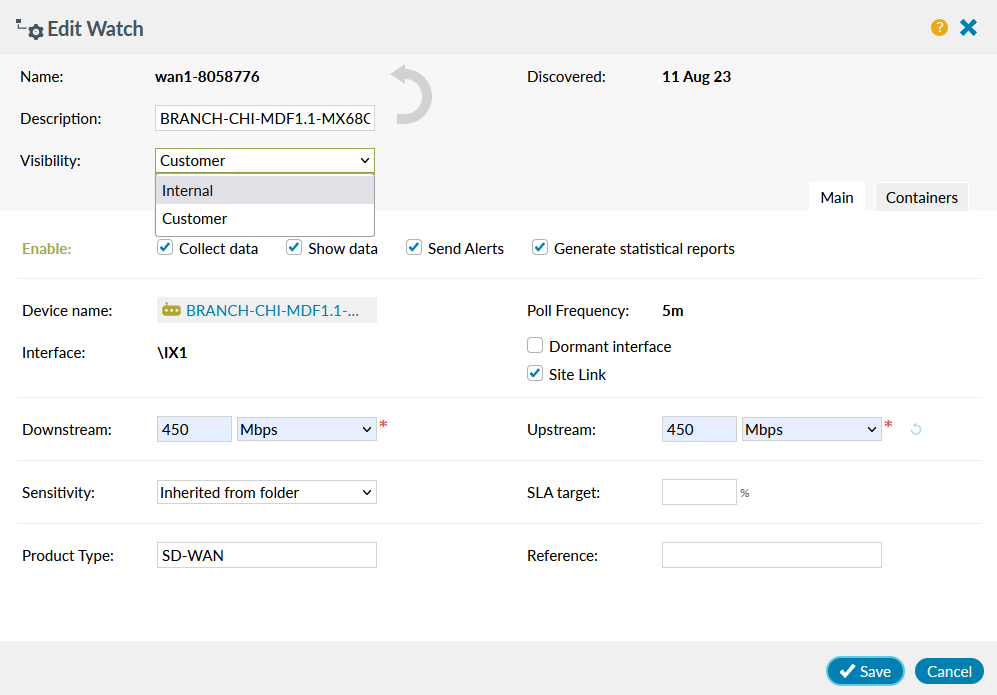
In 23.10 the Details page for switch ports has been updated. It's also possible to apply site links and visibility settings on SD-WAN uplink bearers.
Switch Ports Details page updated
For switches recognised by Highlight, you can enable LAN switch monitoring to get a fast, detailed picture of how they are performing - traffic levels, health issues, and outages on every port, presented in a simple clear format. You can designate specific ports as 'critical' (for example, server connections) and Highlight will alert if these ports have problems. See a list of supported manufacturers.

Critical ports have a blue background marker in the Port Summary panel.
The Live status of critical ports is indicated by the green/amber/red background of the port number.
Click one to jump to the chart for that port in the lower section of the page.
Highlight scrolls to the relevant port and expands it.
In the Port Summary section, it's now possible to filter the switch ports to focus on those you are interested in.

- All
- This is the default option. All ports are shown.
- Active
- This includes active and critical ports.
Active means the port had data within the selected time period (day, week or month). - Critical
- Only ports which have been designated as critical are shown.

For the switch, this panel shows a chart for each critical port designated in Highlight. Only critical ports can change the colour of a heat tile and generate an alert email or webhook. Charts are labelled with the slot and port number and that port’s alias or interface name, if one has been configured on the switch.
Like all other charts on the details page, critical port charts have the following enhancements:
- Hover on a data point to see timestamp and precise values
- Click to jump to a specific date from a week or month view
- Drag across a chart to zoom in to a particular time period
- See other charts aligned to the same timescale so you can quickly recognise the impact of an event
Find out more about:
SD-WAN uplinks Visibility and Site Link options

Visibility
This is shown only if you are a service provider. It determines if the watch will be visible to all users or just to service provider internal staff. There are two options:
- Customer: this is the default. Anyone can view the watch, and those with permission "edit watch" can edit/delete it.
- Internal: customers cannot view, edit or delete this watch as it is only seen by service providers.
Site Link
Where resilient links are deployed at a location, it is possible to generate a site availability statistic in a report, to determine if there was any period when all links which support site access were down.
Find out more about: Site Availability and editing SD-WAN uplinks.
Bug fixes
- Sensitivity profiles: Resolved an issue where sensitivity profiles on a watch might be overridden.
Service description
The Highlight Service Description document concisely describes how Highlight works and its key features. It has been updated for 23.10 and is available on the Help & Support Centre.
Browser compatibility
Highlight 23.10 has been tested on the current version of the following browsers:

Chrome

Edge

Firefox
Find out more about Highlight supported browsers.
Get in touch
More details on all of Highlight’s features are available on the Help & Support Centre or contact us for assistance.