Admin Reports
Overview

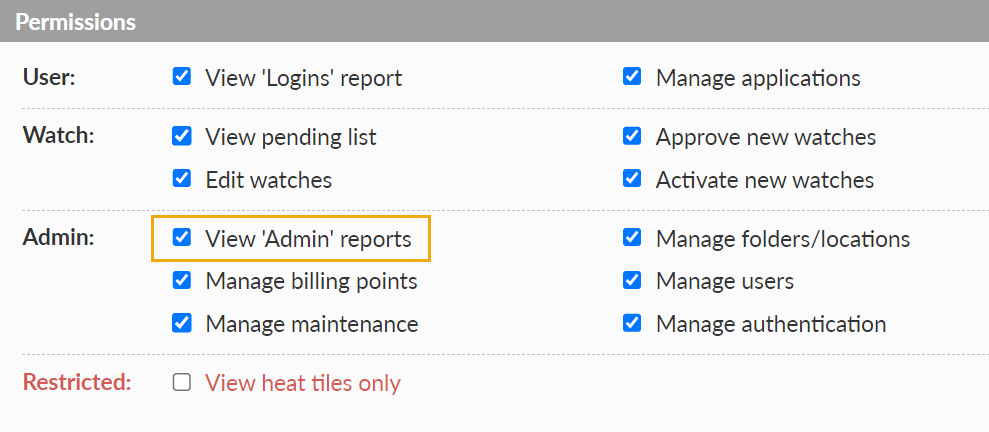
Use these options to generate a CSV report showing either user or watch details. The report will include details for the folder currently selected in the Network Explorer tree and any subfolders. A report cannot be run when Favourites is selected in the Network Explorer tree. These options are only visible if you have the permission View Admin reports.

User Report

- User
- the user's name eg 'Alex Baker'
- the user's login email eg 'alex.baker@kfv-services.com
- Folder
- the user's folder name
- Login Count
- the number of times the user has ever logged in successfully
- Last Login
- the date and time in UTC of the user's most recent login
- Permissions
- a string representing the user's privileges eg 'ESWRC'
- A
- Approve new watches
- B
- Manage billing points
- C
- Manage folders/locations
- E
- Manage users
- F
- View 'Logins' report
- G
- Manage applications
- H
- View heat tiles only
- M
- Manage maintenance
- R
- View Admin reports
- S
- View pending list
- U
- Activate new watches
- W
- Edit watches
- X
- Manage authentication
- Date Created
- the date the user was created in Highlight
- Date Expires
- the expiry date of the user
- Path
- the full path, starting from the logged-in user's home folder, to this user's home folder or location
- Department
- the user's department if completed at first login or after via the Getting started dialog or My Account page, otherwise blank if not completed. Available options include:
- Operations/Service Desk
- Service Management
- Sales/Account Management
- Network Engineering
- Finance
- Service Deliver
- IT Management
- Other
- Knowing a user's department enables Highlight to tailor their experience so it is most suited to them and to keep them informed about the most relevant Highlight features
Watch Report


Note: only bearer (ie: ADSL, SDSL and DedicatedAccess) and Flow watches are returned
- Folder
- the path (excluding location) to this watch, starting from your home folder
- Location
- the location name for this watch
- Country
- the two-character ISO country code for this location eg 'FR'
- Name
- the watch name
- Description
- if configured, the watch description
- Watch Type
- as a string, 'LinkHealthDedicatedAccess' or 'LinkHealthADSL' or 'LinkHealthSDSL'
- Expires (UTC)
- the expiry date and time of the watch; empty if no expiry date
- Created (UTC)
- the create date and time of the watch
- Device
- IP address
- Interface
- name of interface being monitored
- Access In, Access Out, TierIn, Tier Out
- formatted as per the edit watch dialog. eg '1024kb' or '34Mb', using divide-by-1000 rules
- Access In (Raw), Access Out (Raw), Tier In (Raw), Tier Out (Raw)
- formatted in bits per second so data can be sorted
- Features
- a string summarising the enabled features for LinkHealth Bearer watches, using these single letter abbreviations:
- A
- AppVis Application option enabled
- B
- Bandwidth discovery enabled
- C
- Class discovery enabled
- D
- Dormant interface enabled
- F
- Flow enabled
- P
- one or more associated Performance Tests
- M
- Multilink discovery enabled
- N
- NBAR enabled
- S
- Switch watch associated
- V
- VLAN discovery enabled
- Y
- Cellular Clarity enabled
- Z
- Broadband Clarity enabled
- Collect Data
- true (1) or false (0)
- Show Data
- true (1) or false (0)
- Send Alerts
- true (1) or false (0)
- Statistics
- true (1) or false (0)
- Last Good Sample (UTC)
- the date and time of the most recent contact with this watch
- Reference
- the contents of the "Reference:" field when creating or editing a watch
- Poll (secs)
- the polling interval for each watch in seconds, useful to determine the time from when an issue starts until alerts are sent and watches/tiles change colour, refer to the sensitivity page for more details
- Sensitivity Profile
- the profile set on each watch which determines Highlight's reaction speed for sending alerts and changing watch/tile colour. The field will be blank if the watch inherits the folder/location sensitivity setting.
- Product Type
- the contents of the product type field for a watch
- HL Agent
- the agent that is responsible for polling the watch, and if it belongs to a group, the group name is displayed instead and prefixed by "Group: ". If the folder's Agent Selection is set to "No collection" on the Poller & WiFi tab, this is blank. Nothing is shown for Flow watches.
| Asymmetric service | Symmetric service | |
|---|---|---|
| Access In | Bandwidth in | Bearer speed |
| Access Out | Bandwidth out | Bearer speed |
| Tier In | not used | Bandwidth |
| Tier Out | not used | Bandwidth |
Flow watches in Admin watch report

The watch report also shows all Flow watches and when the Last Good Sample was received. Thus this report can be run to confirm that Flow watches are still working as expected; and to identify any that are not, for Flow troubleshooting purposes.