Troubleshooting Switches
Overview
This page explains symptoms experienced with Switch monitoring
Symptom 1. Details page showing "Highlight has no data"

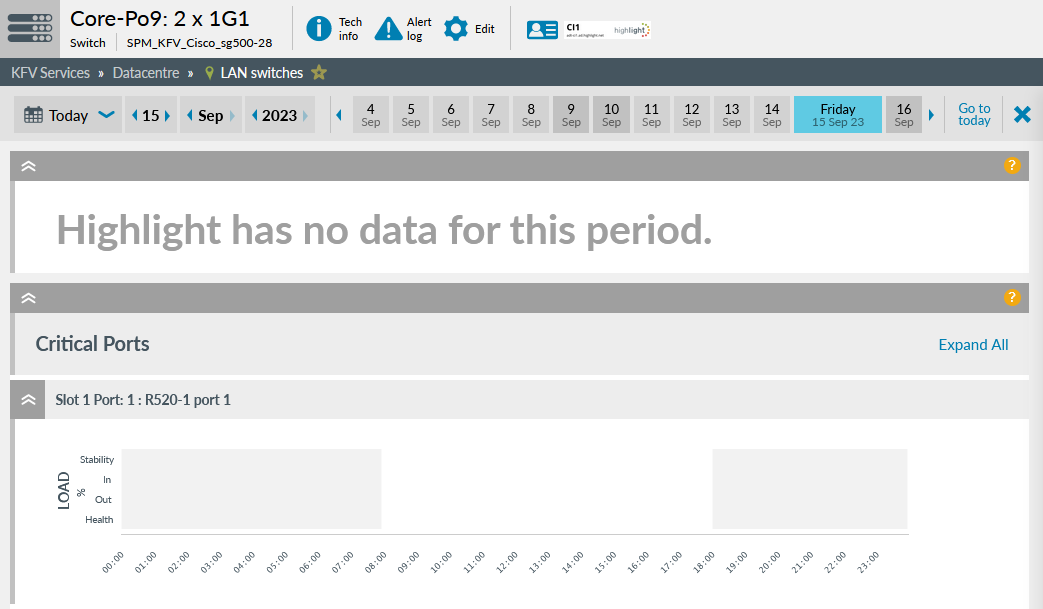
After clicking the Switch card in the watch status panel, if the Details page shows "Highlight has no data for this period" for Port Summary and Critical Ports show empty charts, this is likely to be because Highlight does not currently support switches with greater than 255 ports.
Action:
There is no current solution or workaround. However please contact us to let us know you have experienced this symptom.
Symptom 2. Switch port monitoring not available
If the entry for Switch port monitoring is greyed out in the Edit Watch: Features tab, try going to the Main tab and techtest. If the techtest reports "Identified Switch Device" return to the Features tab to Enable Switch port monitoring.

Note: you have to save and re-open the Features tab to be able to select Critical ports
Symptom 3. Juniper switch port zero not shown
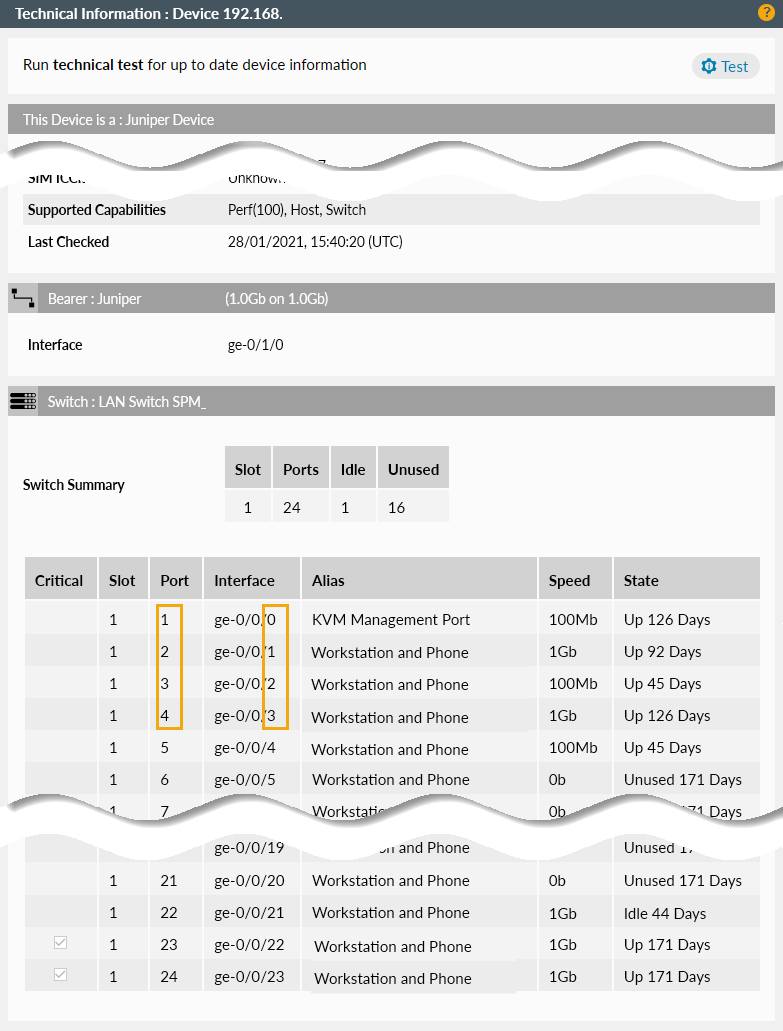
The ports on any switch in Highlight are labelled in the standard way, starting at 1.
Juniper switches start from port zero. Highlight discovers all ports on a Juniper switch but labels each one number higher than Juniper does.

Symptom 4. Flexible switch error on details page

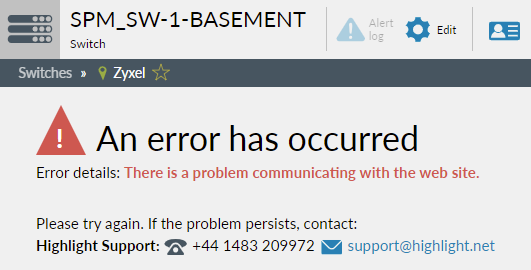
If you see this error on the details page for a flexible switch which previously worked, possible reasons for this include the following:
- A flexible switch has been created on the same device in 2 or more locations
- A previously created interface on a flexible switch has been removed
Action:
Contact us to discuss alternative implementations