Troubleshooting Traffic Load Graphs
Overview
This page provides suggestions to explain unexpected traffic load.
Symptom 1. No load displayed in either direction
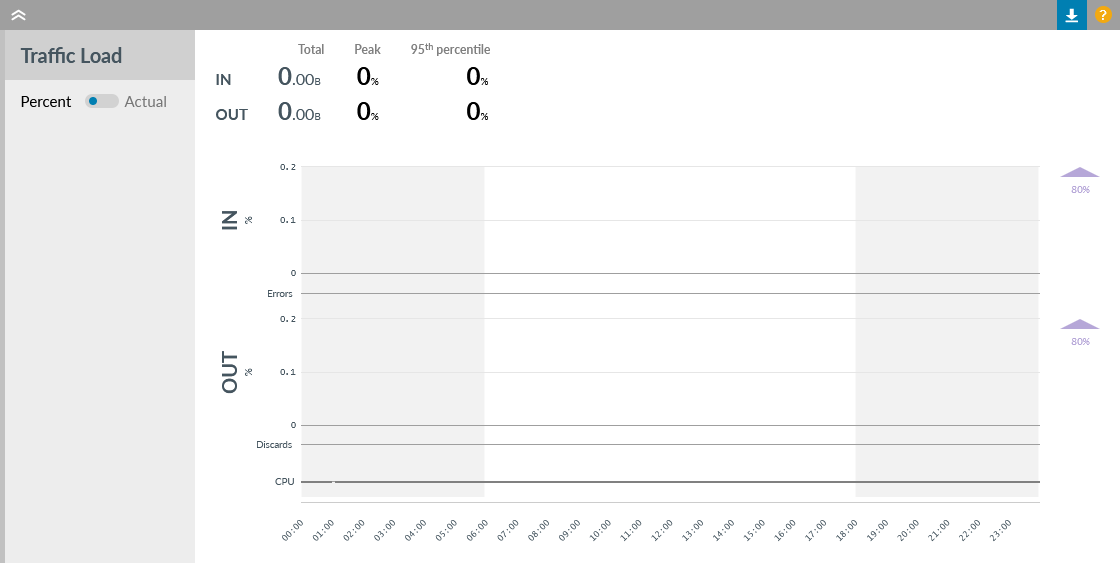
When in the Details page viewing the Traffic Load (%) charts, if no chart points are seen then the likely causes of this are:
- You are viewing an old time period when there was no traffic.
Action: Click on View by "Today" to ensure the charts are current.
- The percentage scaling of the chart might mean average traffic is less than 1%.
Action: Check if the Mean Traffic values for OUT and IN charts are non-zero, in which case check if the service tier speed recorded in the title bar is correct.
- The interface chosen to be monitored by Highlight does not carry traffic or is no longer valid.
Action: Check the interface being monitored by clicking on Tech info. The monitored interface is shown near the bottom.
- The router IOS has a bug.
Action: Check the Line Health chart. If the availability line in the Line Health displays continuous orange, refer to the Troubleshooting Line Availability page.
- (For classes of service) the class is not defined to carry traffic.
Action: Compare the device configuration policies with the customer QoS agreement.
- The tier speed (for dedicated access) or in/out speeds (for ADSL) is set to greater than 160M but the router does not support "High Capacity Counters" which are used by Highlight when the potential throughput exceeds 160M.
Action: Check if the speed set in Highlight is correct and reduce if appropriate.
- The device being monitored is not that expected for this location, potentially because the wrong IP was used during the setup.
Action: check the hostname being monitored is correct by clicking Tech info. The hostname as reported by the device is shown on the top line.
- The circuit is a backup and traffic is not expected under normal conditions
Action: none required
Symptom 2. Load displayed in only one direction
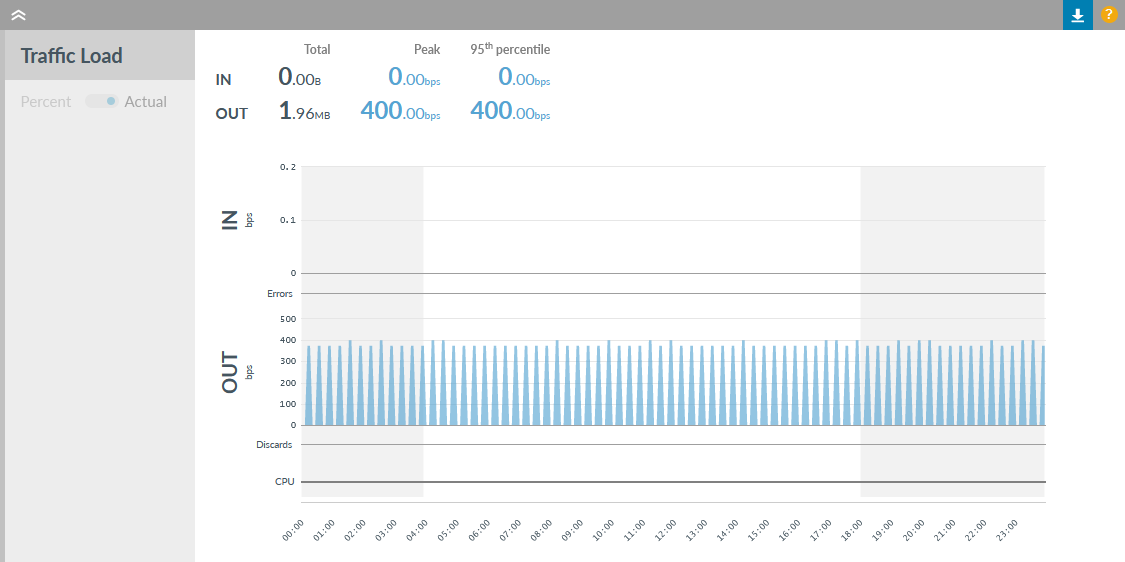
When in the Details page viewing the Traffic Load charts, if traffic is recorded in only one direction then the likely causes of this are:
- (For classes of service) there is a missing or misconfigured router policy.
Action: Check the device configuration policies to confirm they are present and conform to the naming convention agreed between the service provider and ourselves. If further detail is required please contact us.
- This device is part of a resilient service and the partner device is carrying load in the other direction.
Action: Check the partner device if monitored in Highlight, and also check the routing plan to determine if this symptom is as intended.
Symptom 3. Percentage v Actual bps charts
Peak load statistics
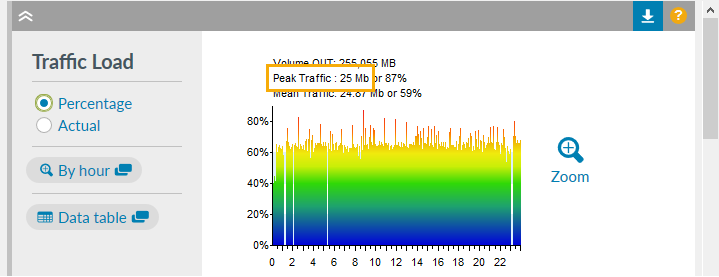
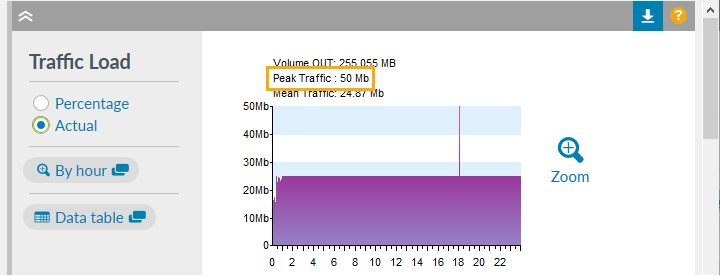
It is possible that the reported Peak Traffic differs betweeen the Percentage chart and the bps chart.
This will occur if the bandwidth changes during the day. The cause is the way Highlight selects the peak:
- For percentage charts the samples are sorted into percent order and the peak traffic displayed corresponds to the highest percent value
- For bps charts the samples are sorted into bps order and the peak traffic displayed corresponds to the highest value
If the bandwidth in Highlight is increased but the traffic levels are fairly consistent then the peak percent before the change is going to be higher than after, even if the actual peak traffic load is after the change. The true peak bps is on the bps chart.
In this example the bandwidth in Highlight was changed from 20M to 25M at noon, and the reported peak bps figures differ:
| Peak time | Load bps | Load percent |
|---|---|---|
| (before noon) 10:42 | 15Mbps | 75% of 20M |
| (after noon) 14:15 | 16Mbps | 64% of 25M |
| Peak percentage | 15Mbps | 75% |
| Peak bps | 16Mbps |
Symptom 4. Low traffic load on discovered MLE ports
Currently Juniper switch ports discovered using Multilink autodiscovery will be the .0 virtual interfaces rather than their parent physical interfaces. Traffic levels reported on these sub-interfaces may be significantly lower in total that the original virtual channel selected for monitoring.
The workaround for Juniper switches is to set up Link Health monitoring on the individual physical interfaces rather than rely on the autodiscovered ports.
Symptom 5. Spike or gap in traffic load
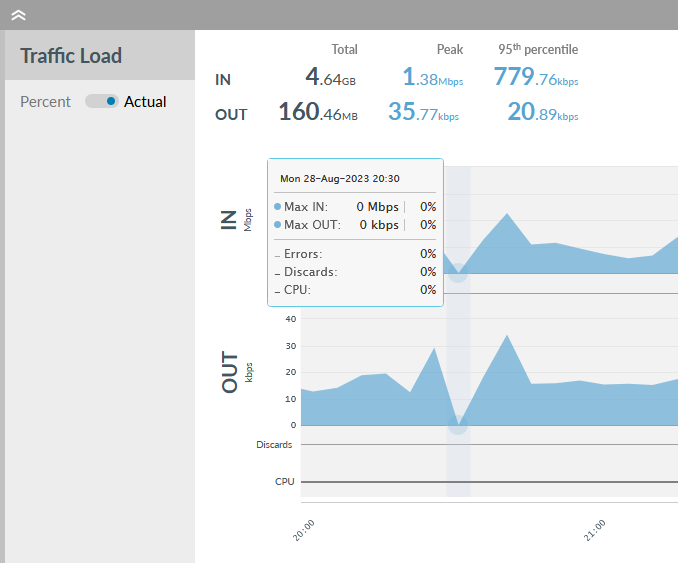
A short spike or gap in traffic load can be caused by interface counters being cleared on the monitored device by a local engineer.
Because average speed in each poll sample is calculated from the difference in the total bytes between this poll and the previous, if the counters are cleared then a spurious negative difference is calculated. This is either ignored and recorded as zero by Highlight (if a 64bit counter), or interpretted as a counter wrapping back to zero. If the latter highlight calculates throughput as 2^32 + current value - last value, and typically produces a massive average speed for one sample only.
There is no indication to Highlight that counters have been cleared.
Symptom 6. High load
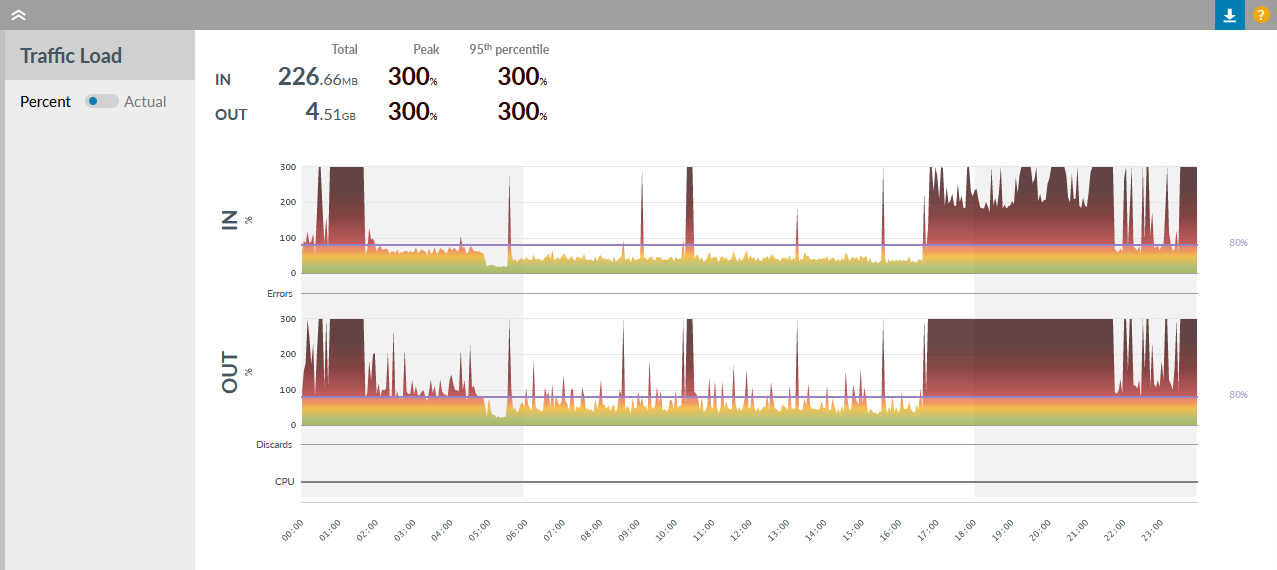
When Highlight is showing traffic loads at 100% to 300% of the currently configured bandwidth, or the Actual/bps chart shows values higher than the circuit can hold, the likely cause is the bandwidth configured on the watch is significantly lower than the actual circuit. We recommend reviewing the bandwidth setting and updating it accordingly.
Symptom 7. Summary data different from reporting data
There may be a small variation between the load values in Reporting and on the Details page Traffic Load Summary. In Reporting, raw data is summarised for each day and rounded then aggregated for the week or month value. On the Details page, raw data is used for day, week or month values.
Symptom 8. Discards
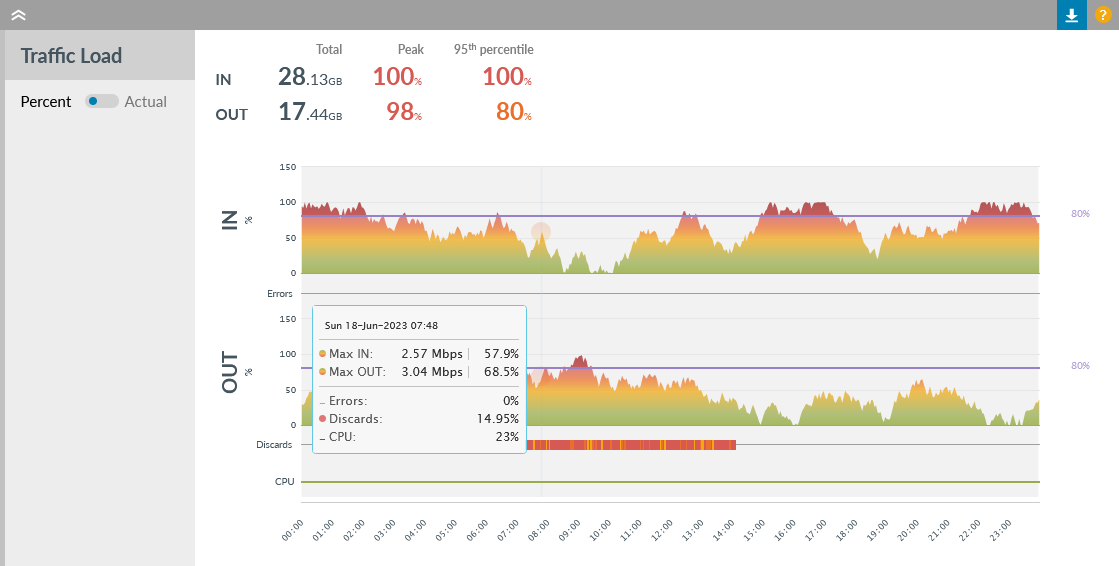
If repeated discards are displayed, possible reasons for this include:
- More traffic arrives at an interface to be sent than can be buffered there
- Traffic is being discarded as a result of a policy map applied to the interface configuration
Note that packet discards are measured as a proportion of overall packets. If more than 1 packet in 100,000 is discarded then coloured blips will be displayed, becoming red once it exceeds 1 discard every 1000 packets.